Table of Contents >> Show >> Hide
- What Is a Gantt Chart in Word?
- Before You Start: What You Need for Your Word Gantt Chart
- How to Make a Gantt Chart in Word: 8 Steps
- Step 1: Open a Blank Word Document and Set the Page Layout
- Step 2: Insert a Table to Build the Chart Structure
- Step 3: Label the Header Row Clearly
- Step 4: Enter Your Tasks and Timeline Details
- Step 5: Shade the Timeline Cells to Create the Gantt Bars
- Step 6: Add Milestones and Dependencies
- Step 7: Format the Chart for Readability
- Step 8: Review, Update, and Save a Reusable Template
- Tips to Make Your Word Gantt Chart Look Better
- Common Mistakes to Avoid
- When Word Is a Good Choice for a Gantt Chart
- Conclusion
- Practical Experiences and Lessons Learned When Making a Gantt Chart in Word
- SEO Tags
If you have ever opened Microsoft Word and thought, “Yes, this is clearly the ideal place to build a project timeline,” first of all, bold choice. Second, you actually can make a Gantt chart in Word without pulling out your hair strand by strand like a stressed-out cartoon villain.
A Gantt chart is one of the easiest ways to visualize a project schedule. It shows your tasks on one side and a timeline on the other, with horizontal bars that reveal when each task starts, how long it lasts, and where work overlaps. In plain English, it turns your project from a chaotic wall of dates into something your eyes can understand before your coffee kicks in.
Now, let’s be honest: Word is not a full-blown project management platform. It does not wake up every morning dreaming of dependencies, milestones, and resource allocation. But for simple schedules, client deliverables, school projects, marketing calendars, or one-page team plans, a Word Gantt chart can do the job surprisingly well.
In this guide, you’ll learn how to make a Gantt chart in Word in 8 practical steps, plus how to format it so it looks polished instead of “made in a hurry five minutes before the meeting.”
What Is a Gantt Chart in Word?
A Gantt chart in Word is a manually built project timeline created inside a Word document. Instead of relying on specialized software, you use Word’s layout tools, tables, cell shading, borders, and text formatting to create a visual schedule. Each row usually represents a task, and each shaded section across the row represents the time that task will take.
This approach works best when you need:
- A simple project timeline in Word
- A printable Gantt chart for a report or proposal
- A schedule that can be shared with clients who may not use project software
- A basic visual plan without advanced automation
If you need live progress tracking, automatic dependency handling, or constant updates from multiple teammates, dedicated software will save you time. But for a clean, static, easy-to-share timeline, Word is still a useful option.
Before You Start: What You Need for Your Word Gantt Chart
Before you touch the ribbon, gather the information that will go into your chart. This makes the actual setup much faster and helps you avoid that classic project-management mistake: making the chart first and figuring out the plan later.
Have these details ready:
- Project task names
- Start dates
- End dates or durations
- Important milestones
- Task owners, if needed
- Any dependencies between tasks
Here is a quick example for a website launch project:
- Research and planning
- Wireframes
- Design approval
- Copywriting
- Development
- Testing
- Launch
Once you know your tasks and timeline, building the chart becomes much easier.
How to Make a Gantt Chart in Word: 8 Steps
Step 1: Open a Blank Word Document and Set the Page Layout
Start with a blank document in Word. Then switch the page to Landscape orientation. This gives you more horizontal space for the timeline, which is pretty important for a chart that is literally based on horizontal bars. A narrow portrait page and a Gantt chart go together about as well as socks and puddles.
Also consider reducing your margins slightly so you have more room for date columns. If your project spans several weeks or months, every bit of space helps.
Step 2: Insert a Table to Build the Chart Structure
The simplest way to create a Gantt chart in Word is by using a table. Insert a table with enough columns for your task information and timeline. A common structure looks like this:
- Column 1: Task name
- Column 2: Start date
- Column 3: End date or duration
- Remaining columns: Days, weeks, or months in the timeline
If you are creating a short project, your timeline columns might represent days. For a longer project, use weeks or months so the chart stays readable. Nobody wants a 47-column masterpiece that requires a magnifying glass and a support group.
Step 3: Label the Header Row Clearly
In the first row of the table, add your labels. Keep them short and consistent. For example:
- Task
- Start
- End
- Week 1
- Week 2
- Week 3
- Week 4
You can also use exact dates if your audience needs precision. If this chart will be shared in a proposal, a report, or a meeting deck, clear labeling matters. A Gantt chart should answer questions instantly, not inspire a scavenger hunt.
Step 4: Enter Your Tasks and Timeline Details
Now fill in the first few columns with your task names and dates. Keep task names action-oriented and specific. “Design homepage” is much better than “Design stuff.” “Test checkout flow” is much better than “Fix website maybe?”
Use one row per task. If you have phases, you can add a parent row like “Planning” or “Execution” and bold it to separate sections. This makes the chart easier to scan, especially when your project has multiple moving parts.
At this stage, your chart will still look more like a spreadsheet wearing Word’s clothing. Don’t worry. The magic happens in the next step.
Step 5: Shade the Timeline Cells to Create the Gantt Bars
This is the step that turns your table into a real Word Gantt chart. For each task row, identify the timeline cells that match the task’s duration. Then apply shading to those cells. That colored block becomes the visual bar for the task.
For example, if “Wireframes” runs from Week 2 through Week 3, shade those two cells in that row. If “Development” lasts from Week 4 through Week 7, shade those four cells.
Use a consistent color for task bars, such as blue or gray. If you want to get fancy, use different colors for different project phases. Just don’t create a rainbow explosion unless your goal is to distract people from the actual schedule.
Step 6: Add Milestones and Dependencies
A better Gantt chart does more than show duration. It also highlights key deadlines and logical order. That is where milestones and dependencies come in.
A milestone is a major checkpoint, such as “Design Approved” or “Launch Day.” In Word, you can mark milestones by:
- Using a single shaded cell in a bold accent color
- Adding a symbol like ◆ or ● in the appropriate timeline cell
- Applying bold text to the milestone task row
Dependencies are the relationships between tasks. For example, testing usually cannot start before development is finished. Word will not automatically draw dependency lines the way project software does, so keep it simple. You can add notes in the task name, include a separate “Depends on” column, or use arrows and shapes sparingly if needed.
The goal is clarity, not a crime-scene diagram made of lines.
Step 7: Format the Chart for Readability
Once your bars are in place, clean up the formatting. This is the difference between “helpful project visual” and “mysterious table from an abandoned office printer.”
Here are a few formatting tips:
- Bold the header row
- Center the timeline labels
- Adjust row height so bars are easy to see
- Widen the task column so text does not wrap awkwardly
- Use light borders so the grid stays visible without looking busy
- Keep colors minimal and professional
If you want extra polish, add a title above the chart such as Marketing Campaign Timeline or Construction Project Gantt Chart. You can also add a simple legend if your chart uses multiple colors.
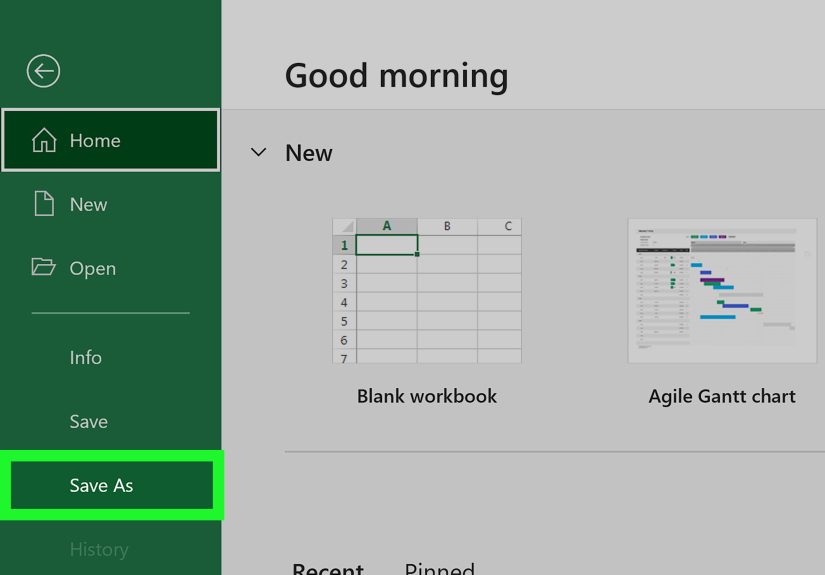
Step 8: Review, Update, and Save a Reusable Template
Before sharing your chart, step back and review it like a reader would. Can someone understand the schedule in less than 30 seconds? Can they spot what starts first, what runs longest, and where the major deadline sits? If not, simplify.
Then save the file as a template for future use. This is one of the smartest things you can do. The first time you build a Gantt chart in Word takes the longest. After that, you can reuse the structure and simply swap out the tasks, dates, and bars.
Congratulations. You now know how to create a Gantt chart in Word without bribing Excel to do the hard part.
Tips to Make Your Word Gantt Chart Look Better
If you want your Word Gantt chart to look less homemade and more boardroom-ready, keep these best practices in mind:
Use the right timeline scale
Do not force daily columns into a six-month plan. Match your scale to the size of the project. Days work for short tasks, weeks for medium timelines, and months for long-term plans.
Limit the number of tasks shown
Word is not ideal for giant, multi-team schedules. If the page becomes overloaded, show only the main phases and high-priority tasks.
Keep labels short
Long labels make the chart harder to scan. Use concise, descriptive wording and put detailed notes somewhere else in the document if needed.
Use consistent color coding
If blue means planning, keep it blue throughout. If red means milestone, do not suddenly make red mean “sort of done but emotionally unfinished.”
Update it regularly
A Gantt chart is only useful if it reflects reality. An outdated schedule is just decorative fiction.
Common Mistakes to Avoid
Even a simple project timeline in Word can go off track if you skip the basics. Watch out for these common mistakes:
- Too much detail: If every tiny task has its own row, the chart becomes cluttered.
- Unclear dates: If the timeline labels are vague, people will misread the schedule.
- Messy formatting: Too many colors, borders, and fonts make the chart harder to use.
- No milestones: Without key checkpoints, the timeline feels flat.
- Forgetting dependencies: Tasks do not happen in a vacuum. Show important sequencing somehow.
When Word Is a Good Choice for a Gantt Chart
Making a Gantt chart in Word makes sense when you need a quick, static, presentation-friendly schedule. It is especially useful for:
- Project proposals
- Client deliverables
- Internal one-page timelines
- School and academic planning
- Simple marketing or content calendars
If you need advanced scheduling, automatic updates, or live collaboration, Word will feel limiting. But if your main goal is to explain a plan clearly in a document, it is still a practical tool.
Conclusion
Learning how to make a Gantt chart in Word is really about learning how to turn a basic document into a visual project plan. With the right setup, Word can help you present tasks, dates, milestones, and progress in a way that is easy to understand and easy to share.
The process is not complicated: set up the page, build a table, enter your tasks, shade the timeline, add milestones, and format everything so it reads cleanly. That is it. No expensive software. No dramatic spreadsheet showdown. Just a smart, simple chart that helps people see the plan.
For small and medium projects, a Word Gantt chart can be more than enough. And once you build one template, the next chart becomes much faster. That means less time wrestling with layout and more time actually managing the work.
Practical Experiences and Lessons Learned When Making a Gantt Chart in Word
People often assume that making a Gantt chart in Word is a backup plan, like using a butter knife as a screwdriver. But in real work situations, Word can be surprisingly useful. One of the biggest advantages is that almost everyone already knows how to open, view, and comment on a Word document. That alone removes a lot of friction when you need to share a timeline with clients, managers, vendors, or classmates.
In practice, the biggest lesson is that simplicity wins. The first time someone makes a Word Gantt chart, they usually try to include everything: every subtask, every date, every dependency, every color, and maybe a small emotional support legend. The result is often too crowded to be helpful. The best Word charts tend to focus on the main phases, the most important deadlines, and just enough detail for the audience to understand what happens when.
Another common experience is realizing that page layout matters more than expected. Landscape mode, wider task columns, and consistent spacing can completely change the chart from awkward to professional. Small formatting choices make a big difference. A chart with aligned text, balanced colors, and readable timeline labels immediately feels more trustworthy, even before anyone reads the details.
Many users also learn that Word works best for presenting a schedule, not managing every moving part of one. If your timeline changes constantly, manual edits can become tedious. You may find yourself adjusting shading, shifting milestone markers, and nudging columns around like a tiny schedule mechanic. That is fine for a stable project plan, but it becomes less charming when five deadlines move before lunch.
Still, Word shines when the goal is communication. A clean Gantt chart in a proposal or project report helps people see the roadmap fast. It can reduce confusion in kickoff meetings, make status updates easier, and give stakeholders a simple visual reference without forcing them into new software. That is often more valuable than fancy automation.
The most useful long-term habit is saving your chart as a reusable template. Once you create a good structure, you can use it again for content calendars, product launches, event planning, onboarding schedules, and even home renovation projects. Over time, you stop “building from scratch” and start customizing a format that already works.
So yes, making a Gantt chart in Word may not be the flashiest project management move in the world. But it is practical, flexible, and often exactly what a simple project needs. Sometimes the best tool is not the most advanced one. Sometimes it is the one that helps everyone understand the plan without needing a tutorial, a subscription, or a minor existential crisis.