Table of Contents >> Show >> Hide
- What Is a GitHub Activity E-Ink Display?
- Why E-Ink Is Perfect for GitHub Activity
- How the Hardware Works
- How the Software Gets GitHub Data
- What Should the Display Show?
- Build Workflow: From Idea to Desk Gadget
- Practical Benefits for Developers
- Privacy and Safety Considerations
- Upgrade Ideas
- Common Problems and Fixes
- Experience Notes: What It Feels Like to Use a GitHub E-Ink Tracker
- Final Thoughts
There are two kinds of developers in the world: the ones who check their GitHub contribution graph every morning, and the ones who claim they do not. The second group is adorable. For everyone else, a GitHub activity e-ink display turns that familiar grid of green squares into a calm, always-visible desk companion. No browser tab. No glowing monitor. No notification carnival. Just your coding rhythm sitting quietly on your desk like a tiny productivity scoreboard with excellent battery manners.
The idea behind the project is simple and surprisingly charming: use a small e-paper screen, an ESP32 microcontroller, Wi-Fi, and GitHub activity data to show your latest contribution graph in physical form. Instead of opening your profile to see whether your week looks productive, chaotic, or suspiciously blank, you can glance at a paper-like display that refreshes every few hours. It is part desk gadget, part habit tracker, part developer art piece, and part gentle reminder that “I’ll push it later” is not technically a workflow.
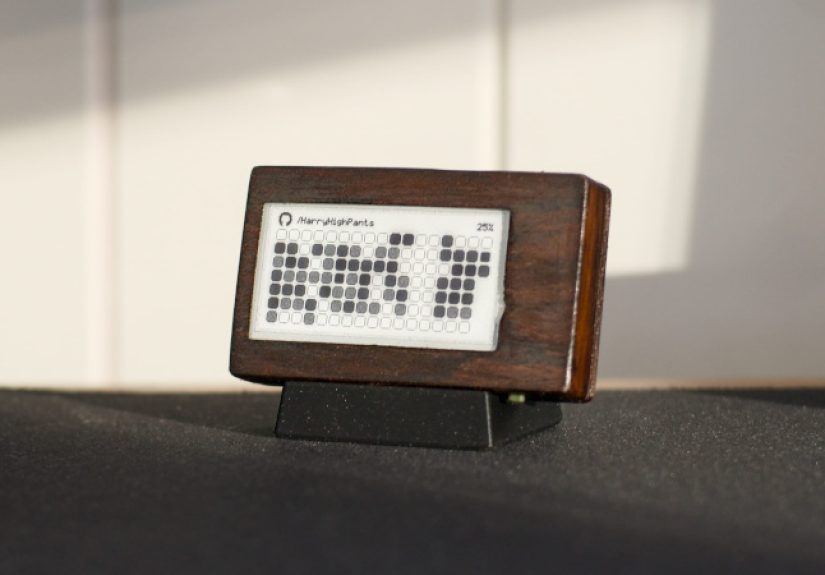
The project popularized by maker HarryHighPants shows how practical this concept can be. It uses an ESP32-based e-paper board, a small Li-Po battery, a 3D-printed case, and firmware that fetches GitHub contribution data wirelessly. The result is a low-power desktop appliance that can display your GitHub activity for weeks or even months between charges, depending on battery size, refresh interval, wireless behavior, and display type.
What Is a GitHub Activity E-Ink Display?
A GitHub activity e-ink display is a small physical screen that shows your GitHub contribution history, usually in the style of the familiar contribution calendar on a GitHub profile. That grid represents days, weeks, and activity levels. On GitHub, contributions can include commits, pull requests, issues, reviews, and other qualifying actions depending on repository visibility and account settings.
The e-ink version takes that digital graph and makes it ambient. It is not meant to replace GitHub, your IDE, your issue board, or your project management tool. Instead, it gives you a fast visual snapshot: Did you code today? Was this week active? Are you maintaining momentum? Did your weekend disappear into “just one quick refactor”? The display answers those questions without asking you to open another screen.
Most versions of this concept use three main ingredients: a Wi-Fi-capable microcontroller such as an ESP32, a small e-paper display, and software that pulls activity data from GitHub. Some builds use an all-in-one development board, such as a LilyGO T5-style e-paper board, because it already combines the ESP32 and screen into a compact package. Others use a Raspberry Pi with a display HAT, which is easier for Python-heavy builders but usually consumes more power.
Why E-Ink Is Perfect for GitHub Activity
E-ink is not fast, flashy, or interested in winning a gaming monitor award. That is exactly why it works so well here. A contribution graph changes slowly. You do not need 144 Hz refresh rates to discover that you merged one pull request and renamed a variable with heroic confidence. You need a display that can hold an image clearly, use very little power, and remain readable under normal desk lighting.
E-paper displays are bistable, meaning they can retain an image without constantly consuming power. Energy is mainly used when the display changes. That makes e-ink ideal for dashboards that update occasionally: calendars, weather panels, server status screens, to-do lists, and, yes, GitHub contribution trackers. If the display refreshes every four hours, it spends most of its life doing almost nothing electrically, which is a beautiful personality trait for a desk gadget.
The visual style also fits the subject. GitHub’s contribution graph is already minimalist: squares, dates, intensity, and pattern recognition. On an e-ink screen, it becomes more like a printed card than a computer widget. It feels less like surveillance and more like a small daily artifact. Your coding activity becomes part of the room instead of another thing trapped behind a login screen.
How the Hardware Works
The most practical build uses an ESP32 board with an integrated e-paper display. The ESP32 handles Wi-Fi, HTTPS requests, data parsing, display rendering, and sleep cycles. The e-paper panel shows the contribution grid. A Li-Po battery powers the device. A 3D-printed case gives it a clean desk-friendly shape and prevents the whole project from looking like a science fair robot had a stressful morning.
Core Components
A typical parts list includes an ESP32 e-paper development board, a compatible battery, a USB cable for charging and flashing firmware, and a case. Some builders may add buttons for manual refresh or display mode switching. Others keep it simple and let the device wake up on a schedule, connect to Wi-Fi, fetch data, redraw the screen, and go back to deep sleep.
The display size matters. A 2.13-inch e-paper display is compact and efficient, but it gives you limited room for labels, legends, and extra statistics. A larger display can show today’s contribution count, current streak, total yearly contributions, recent repositories, or even a tiny motivational message such as “ship it” or “please write tests.” The tradeoff is cost, case size, refresh time, and power use.
ESP32 and Low-Power Behavior
The ESP32 is popular for this kind of project because it combines Wi-Fi, enough processing power, a strong maker ecosystem, and sleep modes that help extend battery life. The best design pattern is simple: wake, connect, fetch, render, sleep. The device should not stay connected to Wi-Fi all day. It should behave like a disciplined little squirrel: wake up, grab the data nut, store the result on the screen, and disappear again.
Deep sleep is especially important. In deep sleep, the ESP32 turns off many internal systems and wakes later by timer or external signal. That is how a small battery-powered dashboard can last far longer than a constantly running microcontroller. In practice, battery life depends on Wi-Fi signal strength, TLS connection time, display refresh duration, battery quality, and whether the firmware properly shuts down unused pins and peripherals.
How the Software Gets GitHub Data
The software side is where the project becomes more interesting than a normal badge display. GitHub offers APIs that can expose user activity, repository events, and contribution-related data. A simple tracker may fetch public events from the REST API. A more accurate contribution graph often benefits from GitHub’s GraphQL API, because contribution calendar objects can represent days, weeks, colors, and total contribution counts in a profile-like structure.
There is one important design decision: what exactly should the display count? Public events are easier to understand, but they may not match the profile contribution graph perfectly. The contribution calendar is closer to what developers expect when they say “my GitHub graph,” but it requires a GraphQL query and authentication. Private repository contributions may also depend on user settings and permissions. For a personal desk gadget, authenticated API access usually gives the best experience.
Authentication and Tokens
If the device uses a GitHub token, security matters. A tiny display does not need the keys to your entire software kingdom. Use the least privilege possible. Store credentials carefully. Avoid hard-coding sensitive tokens into public repositories. If the project includes a web configuration portal, make sure it does not expose secrets after setup. Treat your token like you would treat a house key, not like a sticker on a laptop.
Authenticated requests also help with API limits. A display that refreshes every few hours is unlikely to cause trouble, but sloppy polling can still be wasteful. GitHub’s own API guidance generally favors authenticated requests and avoiding unnecessary polling. For this project, a refresh interval of several hours is sensible. Your contribution graph does not need to update every 30 seconds unless you are trying to turn GitHub into a fitness tracker for fingers.
What Should the Display Show?
The obvious answer is the contribution calendar. It is recognizable, compact, and satisfying. However, the best e-ink GitHub dashboard can show more than green squares. With careful layout, it can become a mini developer dashboard that remains readable at a glance.
Useful Display Elements
The main screen can include the contribution grid, username, current date, last refresh time, today’s contribution count, current streak, longest recent streak, and battery level. If the display is larger, it can show recent repository activity, open pull requests, assigned issues, or review reminders. A dark mode option can invert the layout, which looks stylish on some e-paper panels and gives the device a different personality. Suddenly your desk gadget goes from “calm productivity tool” to “tiny hacker terminal from a very polite cyberpunk movie.”
For small screens, restraint is your friend. Too much information becomes mud. E-ink is crisp, but small e-paper panels still have limited resolution. The contribution grid should be the star. Secondary data should support it, not crowd it. A good rule is: if you cannot understand the screen in two seconds, simplify the design.
Build Workflow: From Idea to Desk Gadget
1. Choose the Board
Start with a board that matches your skill level. If you want the fastest route, choose an ESP32 e-paper board with existing library support. LilyGO T5-style boards are popular because they combine the microcontroller and display. Waveshare-style e-paper modules are flexible, but you may need to wire SPI pins and confirm panel compatibility. Raspberry Pi options are friendlier for web rendering and Python scripts, but they are usually less ideal for long battery life.
2. Pick the Firmware Approach
For ESP32 builds, Arduino or PlatformIO are common choices. Libraries such as GxEPD2 support many SPI e-paper panels and integrate with graphics libraries for drawing text, shapes, and bitmaps. ArduinoJson can help parse API responses on embedded devices. The firmware needs to manage Wi-Fi, API requests, JSON parsing, layout rendering, display refresh, and sleep scheduling.
3. Configure Wi-Fi and GitHub Details
A polished build should avoid editing source code every time the Wi-Fi password changes. A small captive portal can let users configure Wi-Fi, GitHub username, token, refresh interval, display mode, and timezone through a browser. This is one of the nicest touches in the original concept: the device feels less like a fragile prototype and more like a real product.
4. Render the Contribution Graph
Rendering the graph is mostly a layout problem. The software maps dates to squares, contribution counts to intensity levels, and weeks to columns. On a monochrome panel, intensity can be represented with patterns, dithering, outlines, or grayscale if the display supports it. On a tri-color or grayscale panel, the graph can look closer to the web version, but color e-paper often refreshes more slowly.
5. Design the Case
A 3D-printed case makes the project feel finished. It protects the electronics, holds the display at a readable angle, and gives the gadget a place on your desk. Good case design includes USB access, ventilation if needed, room for the battery, and a stable stand. Bonus points if it looks like a miniature museum plaque dedicated to your commits.
Practical Benefits for Developers
This project is fun, but it is not only decorative. A GitHub activity e-ink display can support better development habits. It creates passive awareness. You do not need to check your profile; your progress is already visible. That visibility can encourage consistency, especially for students, open-source contributors, indie developers, and anyone building a public portfolio.
It can also help separate “activity” from “deep work.” The graph is a signal, not a complete measure of productivity. A blank day might mean you were planning architecture, reading documentation, reviewing code offline, designing a feature, or touching grass, which is apparently legal in many regions. The display should motivate, not shame. Green squares are nice, but meaningful work matters more than decorative streaks.
Privacy and Safety Considerations
Any device that connects to an account deserves careful setup. Do not print sensitive repository names on a display that sits in a public office. Do not expose private contribution details unless you are comfortable with people seeing them. Use tokens with limited scope. Keep firmware dependencies updated. If you share your build online, remove secrets from screenshots, configuration files, and serial logs.
It is also wise to add failure states. If the API request fails, show a friendly error and last successful refresh time. If Wi-Fi is unavailable, keep the old image and try again later. E-ink is forgiving because the previous screen remains visible. A failed update does not turn into a blank rectangle of disappointment.
Upgrade Ideas
Once the basic display works, the project invites customization. You can add multiple profiles for team dashboards, a button to switch between contribution graph and pull request view, a weekly summary screen, battery percentage, or a QR code linking to your GitHub profile. You could display open-source milestones, release counts, stars gained, issue response time, or GitHub Actions build status.
Another smart upgrade is a local rendering server. Instead of forcing the ESP32 to do everything, a small server can generate an image and let the ESP32 download it. That approach makes complex layouts easier, especially if you want fonts, icons, charts, or multiple data sources. The tradeoff is that the display now depends on another machine or cloud service.
Common Problems and Fixes
If the screen does not refresh, check panel compatibility, wiring, display driver selection, voltage levels, and the BUSY pin. If the device drains the battery too quickly, inspect Wi-Fi connection time, sleep mode, refresh interval, and whether the board has power-hungry components that remain active during sleep. If GitHub data looks wrong, confirm whether you are using public events, contribution calendar data, or another endpoint. These data sources are related, but they are not always identical.
If the layout looks cramped, remove text before shrinking everything. Tiny fonts make dashboards feel clever for five minutes and annoying forever. If the display ghosts after many refreshes, use appropriate full refresh cycles and follow the manufacturer’s refresh guidance. E-paper is patient, but it has opinions.
Experience Notes: What It Feels Like to Use a GitHub E-Ink Tracker
The real appeal of a GitHub activity e-ink display appears after the novelty phase. At first, it is simply cool. You build it, flash it, configure Wi-Fi, watch the contribution grid appear, and enjoy that small maker victory that says, “I made the internet show up on paper.” Then it becomes part of the desk. You stop thinking of it as a project and start treating it like a quiet status object.
A good e-ink tracker changes how you notice your work. It does not interrupt you. It does not ping. It does not celebrate with confetti or demand that you “complete your profile.” It just sits there. On a busy day, that calmness is refreshing. You might glance over after lunch and see that your morning commits are already reflected. On a slower day, it may remind you that progress does not need to be dramatic. One useful commit, one reviewed pull request, or one fixed issue can still move the graph forward.
The display also makes coding feel more physical. Software work often disappears into tabs, terminals, and cloud services. An e-paper graph gives it a shape. The week becomes visible. The month becomes a pattern. You can see the difference between sprint days, maintenance days, and “I spent four hours debugging a semicolon that was not the problem” days. That kind of visibility can be motivating, especially for people learning to code or trying to build a public portfolio.
There is a small psychological trap, though: the graph can make you want to optimize for activity instead of impact. That is why the best experience comes from treating the display as a reflection, not a boss. It should not pressure you into meaningless commits. A good day is not always green. Sometimes a good day is reading documentation, sketching a database schema, testing a design, or deciding not to ship bad code. The e-ink tracker is most helpful when it supports awareness without turning your desk into a tiny performance review.
Battery life becomes part of the charm. Because the screen only needs power when updating, the device feels almost analog. You can move it around, leave it on a shelf, or place it beside your keyboard without worrying about another cable. A four-hour refresh interval feels natural: often enough to stay current, slow enough to preserve the calm character of e-paper. Manual refresh can be useful, but automatic refresh is what makes the project feel finished.
The best placement is somewhere visible but not central. Put it near a monitor, beside a plant, or next to a notebook. If it sits directly under your eyes all day, it may become another productivity scoreboard. If it sits slightly off to the side, it becomes ambient. That is where this project shines: not as a command center, but as a gentle, paper-like reminder that your work is accumulating one square at a time.
Final Thoughts
Tracking GitHub activity with an e-ink display is one of those projects that makes perfect sense once you see it. GitHub provides the activity data. E-paper provides the low-power, always-visible surface. The ESP32 provides the wireless brain. Put them together and you get a desk gadget that is practical, personal, and just nerdy enough to be delightful.
For developers, it is a fun way to make invisible work visible. For makers, it is a compact lesson in APIs, embedded systems, power management, display rendering, and product design. For anyone who has ever admired a healthy contribution graph, it is a tiny monument to consistency. Just remember: the best GitHub activity display does not merely ask, “Did you commit today?” It quietly asks, “Did you build something that mattered?”